Updated in
July 5, 2010.
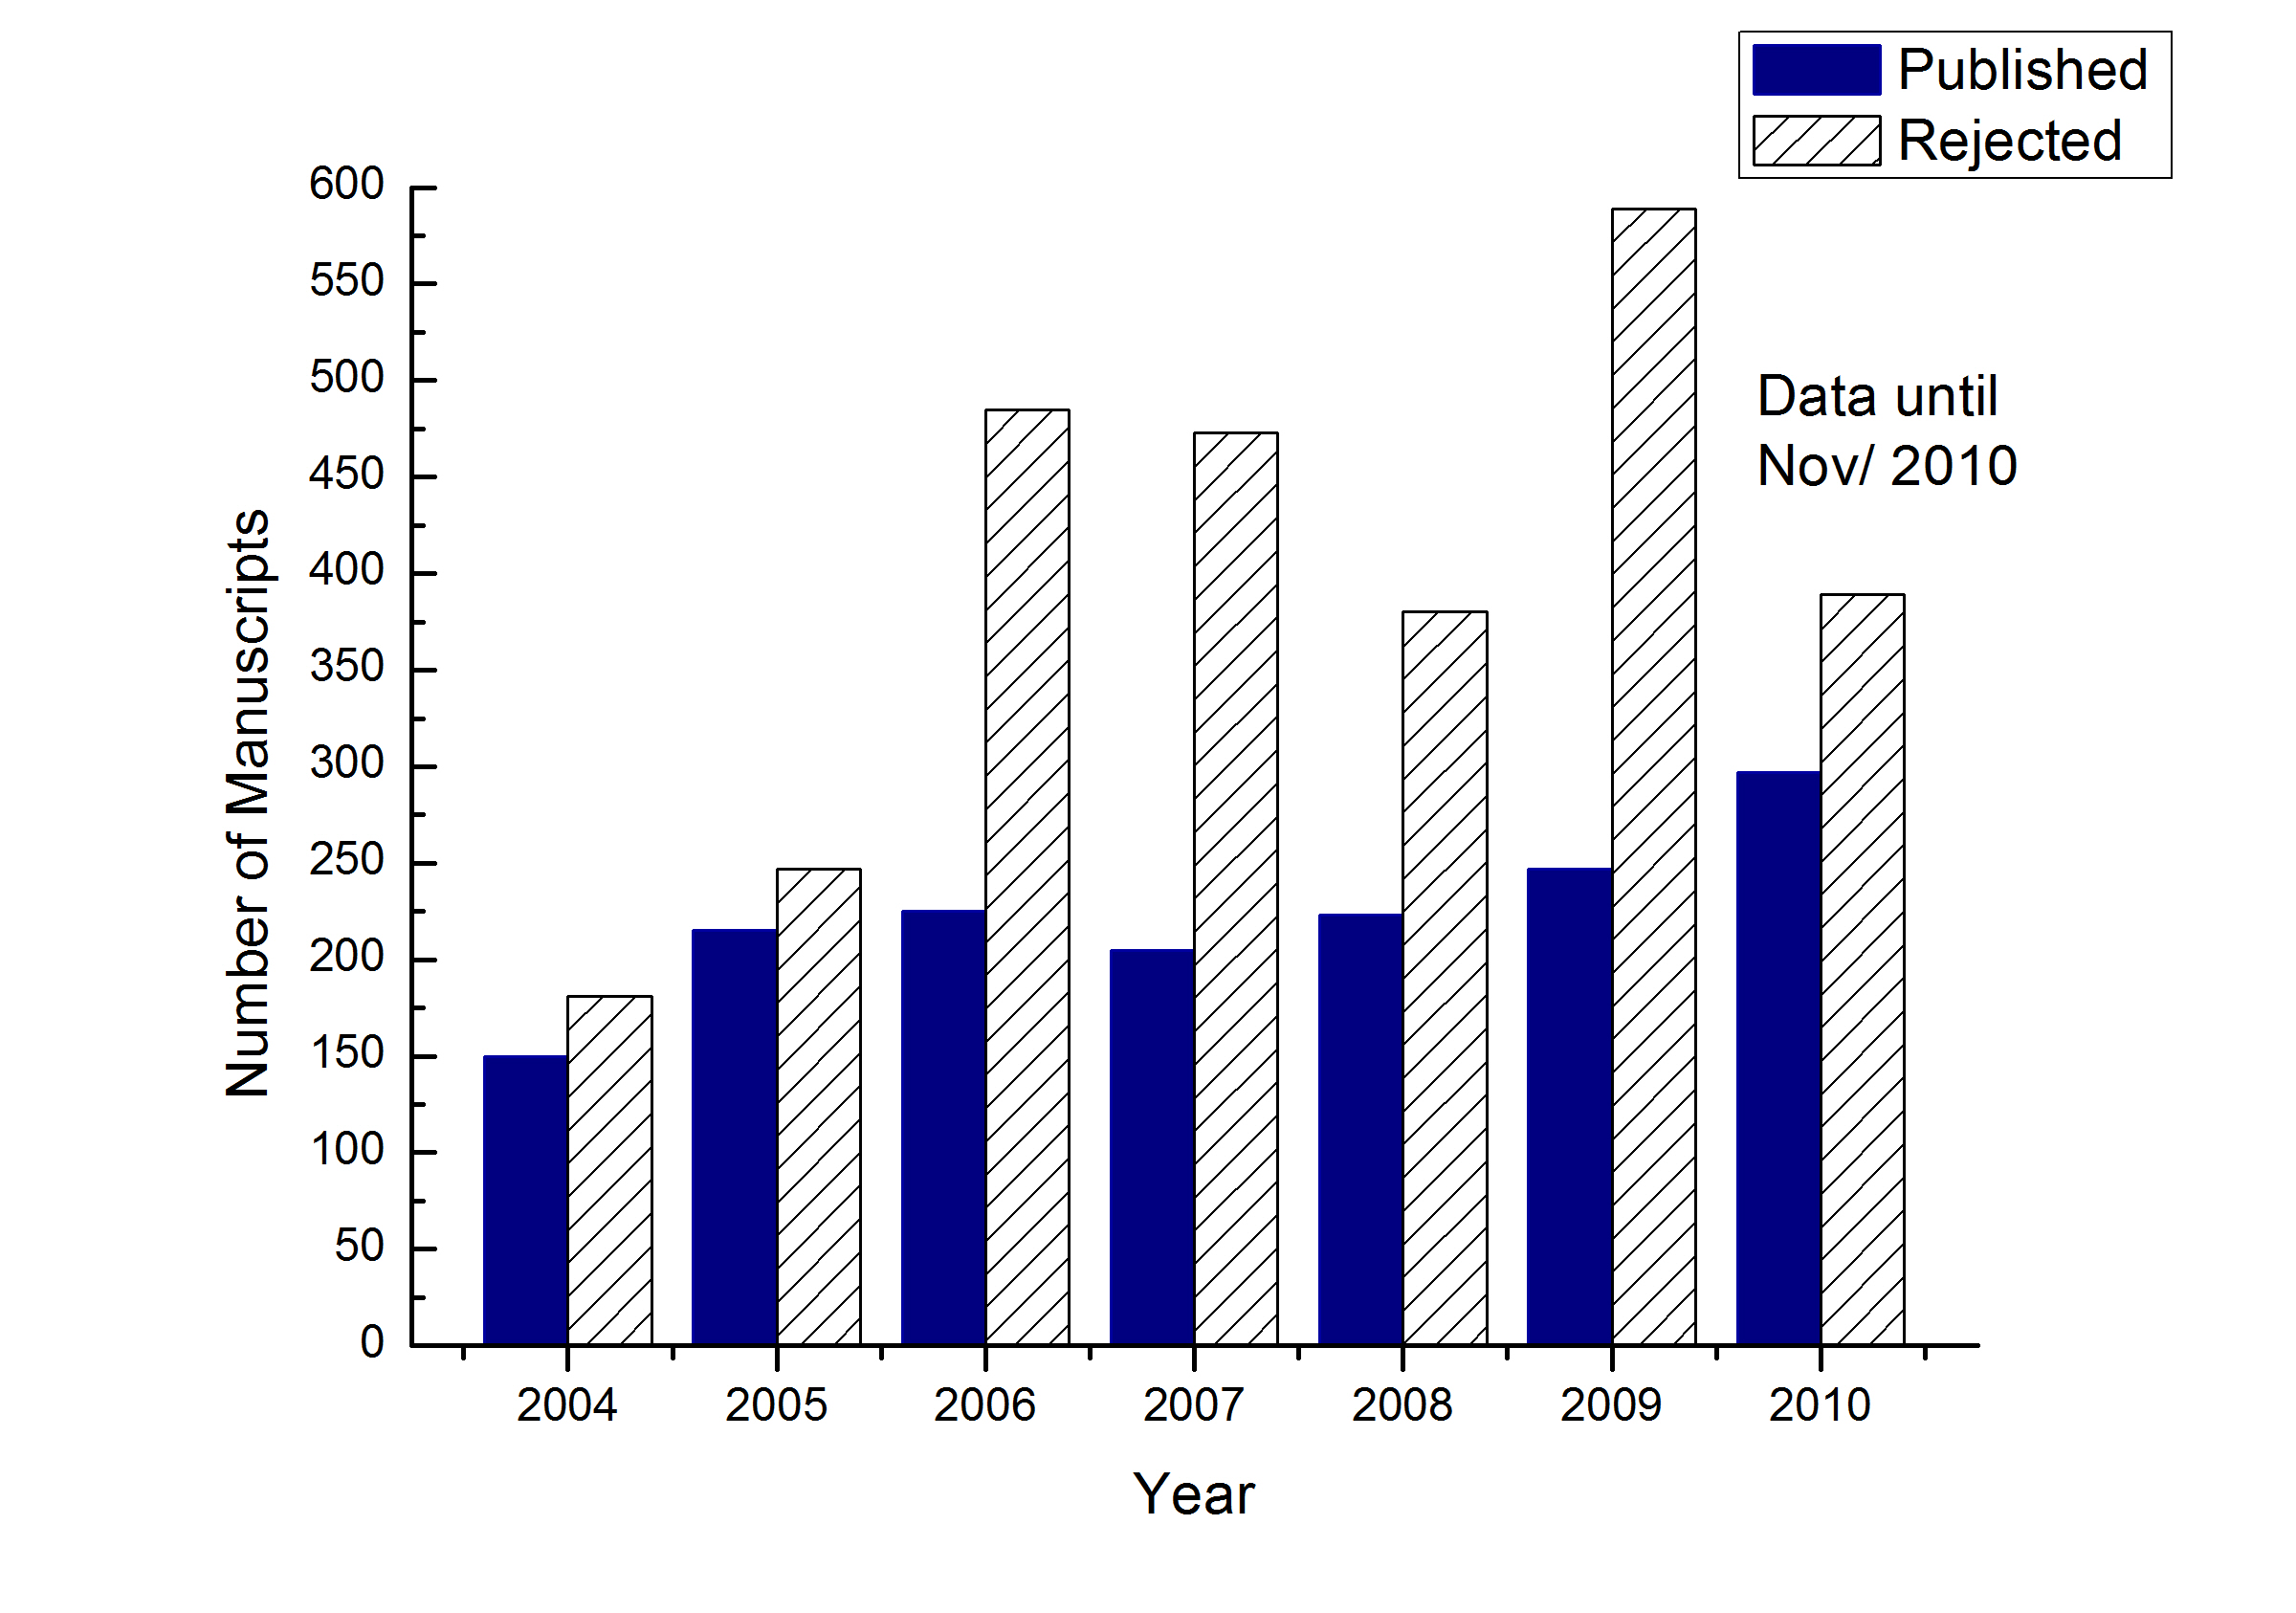
General Overview of the Manuscripts
Evolution of manuscripts submitted
and published in the JBCS from 2004 to 2010:
Table 1.
Processing of manuscripts submitted from 2004 to 2010
Manuscripts
2004
2005
2006
2007
2008
2009
2010
Published
146
194
247
232
226
277
128†
Accepted
*
-
-
2
5
10
6
40
Under
evaluation/Author Review
-
-
1
1
15
3
142
Rejected/Withdraw
141
246
478
465
533
603
405
Total
332**
440
728
703
784
889
715
* accepted,
but not yet available in the website; ** includes 34 manuscripts submitted in hardcopy (not considered in the statistics);† number of manuscripts submitted and published in 2010
Table 2.
Submitted manuscript according to country of origin
(including the ones not processed at all =removed by error of submission)
Origin
of authors
2004
2005
2006
2007
2008
2009
2010
Brazilians
194 (64%)
240 (55%)
330 (45%)
315 (45%)
313 (40%)
386 (46%)
319 (45%)
Non-Brazilians
105 (36%)
200 (45%)
397 (55%)
383 (55%)
470 (60%)
450 (54%)
396 (55%)
Table 3.
Distribution of manuscripts according to subject (including
the ones not processed at all =removed by error of submission)
Areas
2004
2005
2006
2007
2008
2009
2010
Analytical/Environmental
Chemistry
61 (20%)
113 (26%)
174 (24%)
170 (24%)
200 (25%)
204
(24%)
213 (30%)
Electrochemistry
59 (20%)
54 (12%)
84
(11.5%)
143
(20%)
103
(13%)
95
(11%)
94 (13%)
Inorganic
Chemistry
27 (9%)
56 (13%)
113
(15.5%)
76
(11%)
106
(13%)
197 (24%)
78 (11%)
Organic
Chemistry
64 (21%)
83 (19%)
149
(20.5%)
120
(17%)
166
(21%)
119
(14%)
179 (25%)
Natural
Products
36 (12%)
57 (13%)
78
(11%)
74
(11%)
91
(12%)
99
(12%)
66 (9%)
Physical
Chemistry
51 (17%)
76 (17%)
127
(17.5%)
115
(17%)
117
(15%)
122
(15%)
81 (11%)
Table 4.
Type of submited manuscripts
Type*
2004
2005
2006
2007
2008
2009
2010
Article
237
364
593
619
696
748
646
Review
4
10
14
12
8
11
15
Communication
11
8
7
8
13
9
7
Short
Report
47
58
92
64
66
67
45
*see instructions
for authors (in the JBCS website) for description.
Table 5.
Origin of reviewers consulted by the JBCS
Origin*
2004
2005
2006
2007
2008
2009
2010
Brazil
250 (73%)
375 (67%)
502
(69%)
504
(70%)
439
(68%)
474
(64%)
414 (70%)
Abroad
91 (27%)
191 (33%)
227
(31%)
218
(30%)
208
(32%)
273
(36%)
180 (30%)
Total
341
566
729
722
647
747
594
*according
to Institutional address.
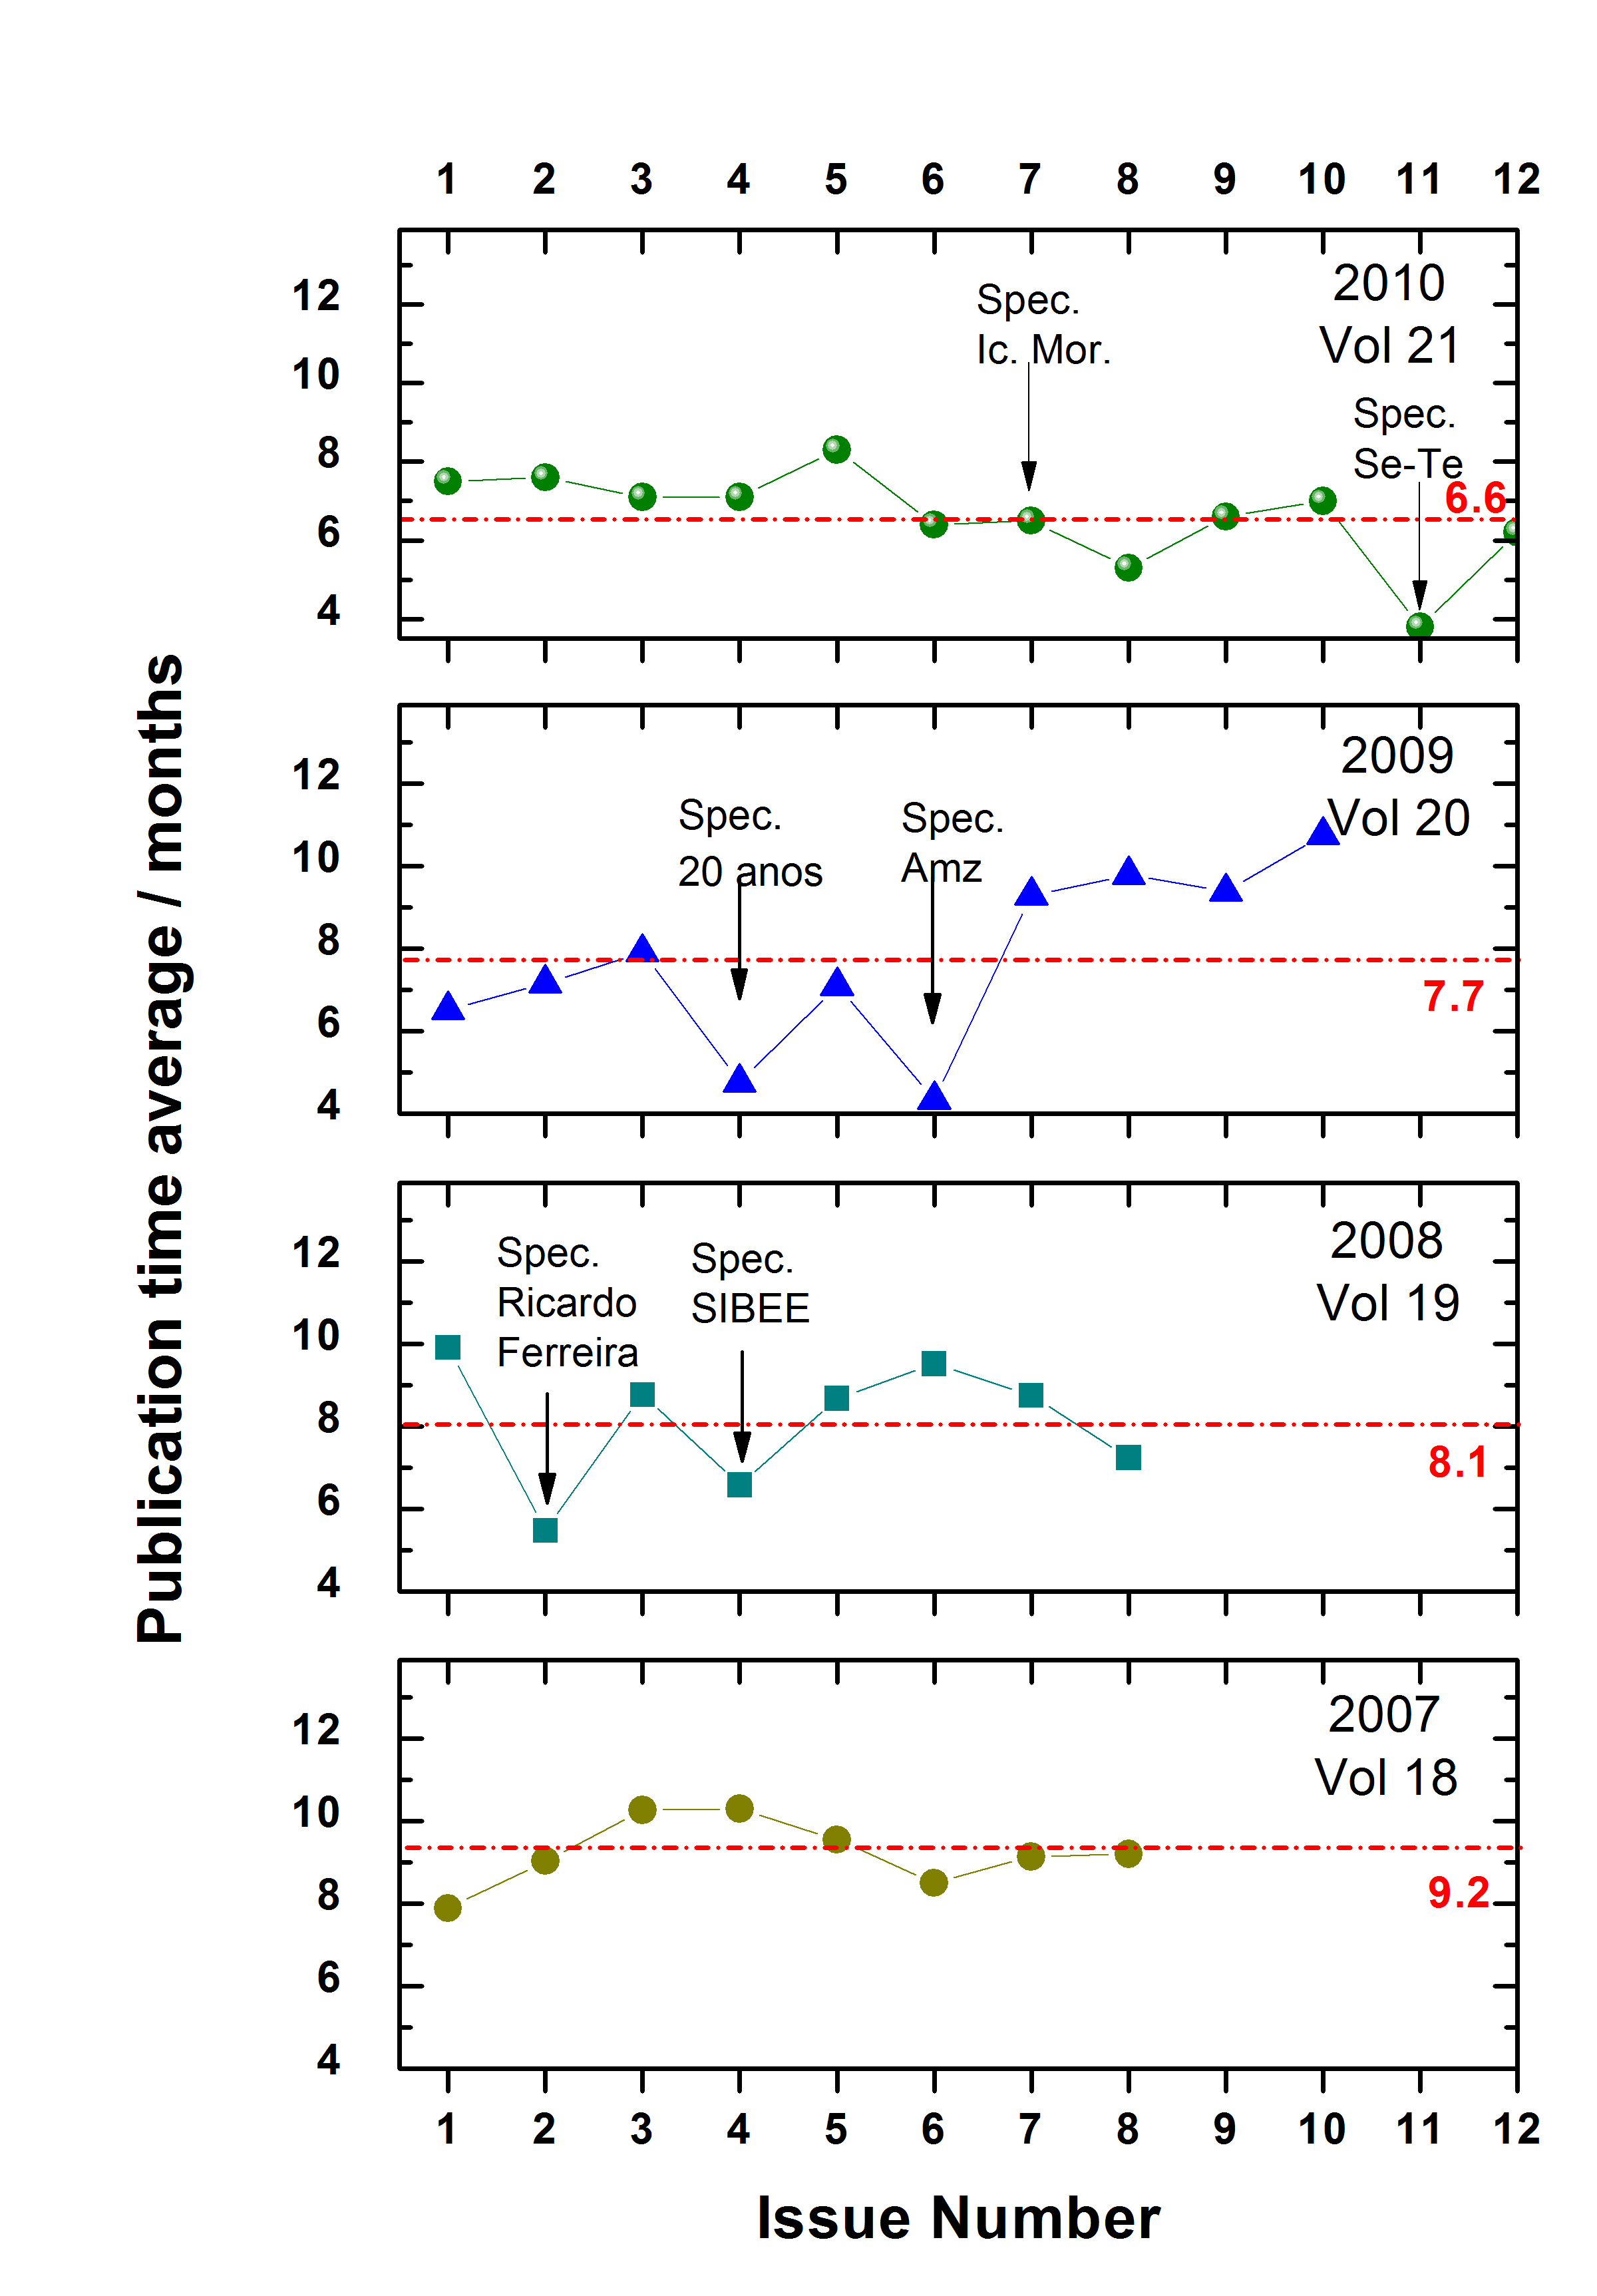
Evolution of publication times (between submission and publication in the website).
Issues 19(2), 19(4), 20(4), 20(6), 21(7) and 21(11) are related to Special issues: